RdTools Overview
RdTools is an open-source library to support reproducible technical analysis of time series data from photovoltaic energy systems. The library aims to provide best practice analysis routines along with the building blocks for users to tailor their own analyses. Current applications include the evaluation of PV production over several years to obtain rates of performance degradation and soiling loss. They also include the capability to analyze systems for system- and subsystem-level availability. RdTools can handle both high frequency (hourly or better) or low frequency (daily, weekly, etc.) datasets. Best results are obtained with higher frequency data.
Full examples are worked out in the notebooks shown in Examples.
To report issues, contribute code, or suggest improvements to this documentation, visit the RdTools development repository on github.
Trends
Both degradation and soiling analyses are based on normalized yield, similar to performance index. Usually, this is computed at the daily level although other aggregation periods are supported. A typical analysis of soiling and degradation contains the following:
Import and preliminary calculations
Normalize data using a performance metric
Filter data to reduce error
Aggregate data
Filter aggregated data to remove anomalies
Analyze aggregated data to estimate the degradation rate and/or soiling loss
It can be helpful to repeat the above steps with both ground-based measurements of weather and satellite weather to check for drift in the ground-based measurements. This is illustrated in the TrendAnalysis with NSRDB example.
Degradation
The preferred method for degradation rate estimation is the year-on-year
(YOY) approach (Jordan 2018), available in degradation.degradation_year_on_year().
The YOY calculation yields a distribution of degradation rates, the
central tendency of which is the most representative of the true
degradation. We note that the workflow described above and implemented in
analysis_chains.TrendAnalysis provides an estimate of degradation rate,
not performance loss rate (PLR). PLR includes losses that are explicitly filtered
out by the primary workflow (Deceglie 2023).
The width of the distribution provides information about
the uncertainty in the estimate via a bootstrap calculation. The
Examples use the output of
degradation.degradation_year_on_year() to visualize the calculation.
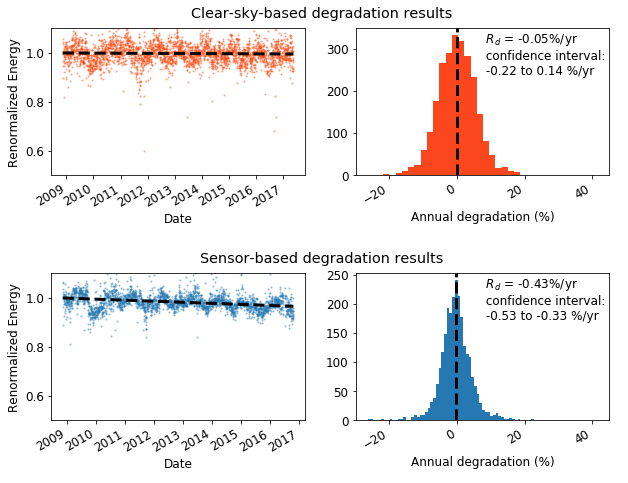
Drift of weather sensors over time (particularly irradiance) can bias the results of this workflow. The preferred way to check for this is to also run the workflow using satellite-derived weather data such as the National Solar Radiation Database (NSRDB) and compare results to the sensor-based analysis. If satellite data is not available, a 'clear-sky' workflow is also available in RdTools. This workflow is based on modeled temperature and irradiance. Note that site irradiance data is still required to identify clear-sky conditions to be analyzed.
Satellite and clear-sky analyses tend to provide less stable results than sensor-based analysis when details such as filtering are changed. We generally recommend that the these be used only as a check on the sensor-based results, rather than as stand-alone analyses.
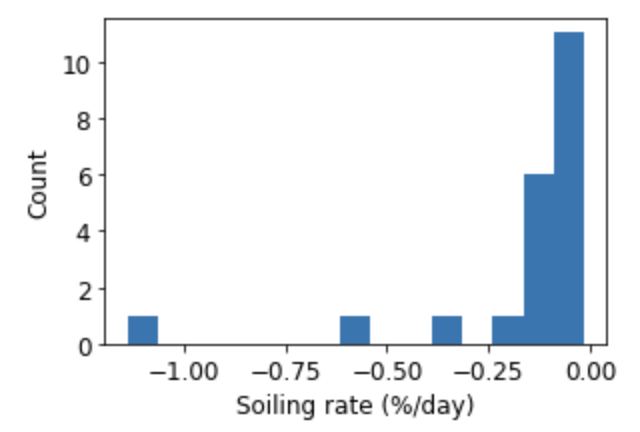
Soiling
RdTools provides two methods for soiling analysis. The first is the
stochastic rate and recovery (SRR) method (Deceglie 2018). This method works
well when soiling patterns follow a "sawtooth" pattern, a linear decline followed
by a sharp recovery associated with natural or manual cleaning.
soiling.soiling_srr() performs the calculation and returns the P50
insolation-weighted soiling ratio, confidence interval, and additional
information (soiling_info) which includes a summary of the soiling
intervals identified, soiling_info['soiling_interval_summary']. This
summary table can, for example, be used to plot a histogram of the
identified soiling rates for the dataset.
The combined estimation of degradation and soiling (CODS) method (Skomedal 2020) is also available in RdTools. CODS self-consistently extracts degradation, soiling, and seasonality of the daily-aggregated normalized performance signal. It is particularly useful when soiling trends are biasing degradation results. Its use is shown in both the TrendAnalysis example notebook as well as the functional API example notebook for degradation and soiling.
TrendAnalysis
An object-oriented API for complete soiling and degradation analysis including
the normalize, filter, aggregate, analyze steps is available in
analysis_chains.TrendAnalysis. See the
TrendAnalysis example for details.
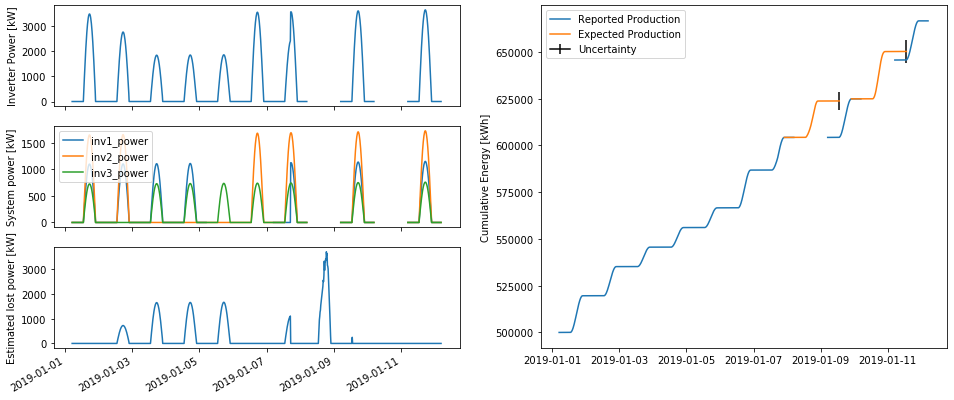
Availability
Evaluating system availability can be confounded by data loss from interrupted
datalogger or system communications. RdTools implements two methods
(Anderson & Blumenthal 2020) of distinguishing nuisance communication
interruptions from true production outages
with the availability.AvailabilityAnalysis class. In addition to
classifying data outages, it estimates lost production and calculates
energy-weighted system availability.
Install RdTools using pip
RdTools can be installed automatically into Python from PyPI using the command line:
pip install rdtools
Alternatively it can be installed manually using the command line:
Download a release (Or to work with a development version, clone or download the rdtools repository).
Navigate to the repository:
cd rdtoolsInstall via pip:
pip install .
On some systems, installation with pip can fail due to problems
installing requirements. If this occurs, the requirements specified in
pyproject.toml may need to be separately installed (for example by using
conda) before installing rdtools.
For more detailed instructions, see the Developer Notes page.
RdTools currently is tested on Python 3.10+.
Usage and examples
Full workflow examples are found in the notebooks in Examples.
The examples are designed to work with python 3.13. For a consistent
experience, we recommend using pixi to set up the
notebook environment. From the base directory, run pixi run lab
to launch JupyterLab with all required packages. Alternatively, install
manually with pip install rdtools[notebooks].
Documentation
Some RdTools function parameters can take one of several types. For example,
the albedo parameter of TrendAnalysis can be a static value like
0.2 or a time-varying pandas.Series. To indicate that a parameter can
take one of several types, we document them using the type alises listed below:
numericscalar or
pandas.Series. Typically int or float dtype.
Citing RdTools
To cite RdTools, please use the following along with the version number and the specific DOI coresponding to that version from Zenodo:
Michael G. Deceglie, Kevin Anderson, Adam Shinn, Ambarish Nag, Mark Mikofski, Martin Springer, Jiyang Yan, Kirsten Perry, Sandra Villamar, Will Vining, Gregory Kimball, Daniel Ruth, Noah Moyer, Quyen Nguyen, Dirk Jordan, Matthew Muller, and Chris Deline, RdTools, version {insert version}, Computer Software, https://github.com/NatLabRockies/rdtools. DOI:{insert DOI}
The underlying workflow of RdTools has been published in several places. If you use RdTools in a published work, you may also wish to cite the following as appropriate:
Dirk Jordan, Chris Deline, Sarah Kurtz, Gregory Kimball, Michael Anderson, "Robust PV Degradation Methodology and Application", IEEE Journal of Photovoltaics, 8(2) pp. 525-531, 2018 DOI: 10.1109/JPHOTOV.2017.2779779
Michael G. Deceglie, Leonardo Micheli and Matthew Muller, "Quantifying Soiling Loss Directly From PV Yield," in IEEE Journal of Photovoltaics, 8(2), pp. 547-551, 2018 DOI: 10.1109/JPHOTOV.2017.2784682
Åsmund Skomedal and Michael G. Deceglie, "Combined Estimation of Degradation and Soiling Losses in Photovoltaic Systems," in IEEE Journal of Photovoltaics, 10(6) pp. 1788-1796, 2020. DOI: 10.1109/JPHOTOV.2020.3018219
Kevin Anderson and Ryan Blumenthal, "Overcoming Communications Outages in Inverter Downtime Analysis", 2020 IEEE 47th Photovoltaic Specialists Conference (PVSC). DOI: 10.1109/PVSC45281.2020.9300635
Kirsten Perry, Matthew Muller and Kevin Anderson, "Performance Comparison of Clipping Detection Techniques in AC Power Time Series," 2021 IEEE 48th Photovoltaic Specialists Conference (PVSC), 2021, pp. 1638-1643, DOI: 10.1109/PVSC43889.2021.9518733
References
The clear sky temperature calculation,
clearsky_temperature.get_clearsky_tamb(), uses data from images created by Jesse Allen, NASA’s Earth Observatory using data courtesy of the MODIS Land Group.
Other useful references which may also be consulted for degradation rate methodology include:
D. C. Jordan, M. G. Deceglie, S. R. Kurtz, "PV degradation methodology comparison — A basis for a standard", in 43rd IEEE Photovoltaic Specialists Conference, Portland, OR, USA, 2016, DOI: 10.1109/PVSC.2016.7749593.
M. G. Deceglie, K. Anderson, D. Fregosi, W.B. Hobbs, M.A. Mikofski, M. Theristis, and B. E. Meyers, "Perspective: Performance Loss Rate in Photovoltaic Systems", Sol. RRL, 7: 2300196. DOI: 10.1002/solr.202300196
Jordan DC, Kurtz SR, VanSant KT, Newmiller J, Compendium of Photovoltaic Degradation Rates, Progress in Photovoltaics: Research and Application, 2016, 24(7), 978 - 989.
D. Jordan, S. Kurtz, PV Degradation Rates – an Analytical Review, Progress in Photovoltaics: Research and Application, 2013, 21(1), 12 - 29.
E. Hasselbrink, M. Anderson, Z. Defreitas, M. Mikofski, Y.-C.Shen, S. Caldwell, A. Terao, D. Kavulak, Z. Campeau, D. DeGraaff, "Validation of the PVLife model using 3 million module-years of live site data", 39th IEEE Photovoltaic Specialists Conference, Tampa, FL, USA, 2013, p. 7 – 13, DOI: 10.1109/PVSC.2013.6744087.
Documentation Contents
- Examples
- API Reference
- Change Log
- v 3.2.1 (July 08, 2026)
- v3.2.0 (July 01, 2026)
- v3.1.1 (March 18, 2026)
- v3.1.0 (March 05, 2026)
- v3.0.1 (August 21, 2025)
- v3.0.0 (January 22, 2025)
- v2.1.8 (November 17, 2023)
- v2.1.7 (November 3, 2023)
- v2.1.6 (July 31, 2023)
- v2.1.5 (May 16, 2023)
- v2.1.4 (December 1, 2022)
- v2.1.3 (January 6, 2022)
- v2.1.2 (December 22, 2021)
- v2.1.1 (November 30, 2021)
- v2.1.0 (September 17, 2021)
- v2.0.6 (July 16, 2021)
- v2.0.5 (2020-12-30) and v2.1.0-beta.2 (2021-01-29)
- v2.0.4 and v2.1.0-beta.1 (December 4, 2020)
- v2.1.0-beta.0 (November 20, 2020)
- v2.0.3 (November 20, 2020)
- v2.0.2 (November 17, 2020)
- v2.0.1 (October 30, 2020)
- v2.0.0 (October 20, 2020)
- v1.2.3 (April 12, 2020)
- v1.2.2 (October 12, 2018)
- v1.2.1 (October 12, 2018)
- v1.2.0 (March 30, 2018)
- v1.1.3 (December 6, 2017)
- v1.1.2 (November 6, 2017)
- v1.1.1 (November 1, 2017)
- v1.1.0 (September 30, 2017)
- Developer Notes