RdTools Overview
RdTools is an open-source library to support reproducible technical analysis of time series data from photovoltaic energy systems. The library aims to provide best practice analysis routines along with the building blocks for users to tailor their own analyses. Current applications include the evaluation of PV production over several years to obtain rates of performance degradation and soiling loss. They also include the capability to analyze systems for system- and subsystem-level availability. RdTools can handle both high frequency (hourly or better) or low frequency (daily, weekly, etc.) datasets. Best results are obtained with higher frequency data.
Full examples are worked out in the notebooks shown in Examples.
To report issues, contribute code, or suggest improvements to this documentation, visit the RdTools development repository on github.
Trends
Both degradation and soiling analyses are based on normalized yield, similar to performance index. Usually, this is computed at the daily level although other aggregation periods are supported. A typical analysis of soiling and degradation contains the following:
Import and preliminary calculations
Normalize data using a performance metric
Filter data that creates bias
Aggregate data
Analyze aggregated data to estimate the degradation rate and/or soiling loss
Steps 1 and 2 may be accomplished with the clearsky workflow (see the Examples) which can help eliminate problems from irradiance sensor drift.

Degradation
The preferred method for degradation rate estimation is the year-on-year
(YOY) approach (Jordan 2018), available in degradation.degradation_year_on_year().
The YOY calculation yields in a distribution of degradation rates, the
central tendency of which is the most representative of the true
degradation. The width of the distribution provides information about
the uncertainty in the estimate via a bootstrap calculation. The
Examples use the output of
degradation.degradation_year_on_year() to visualize the calculation.
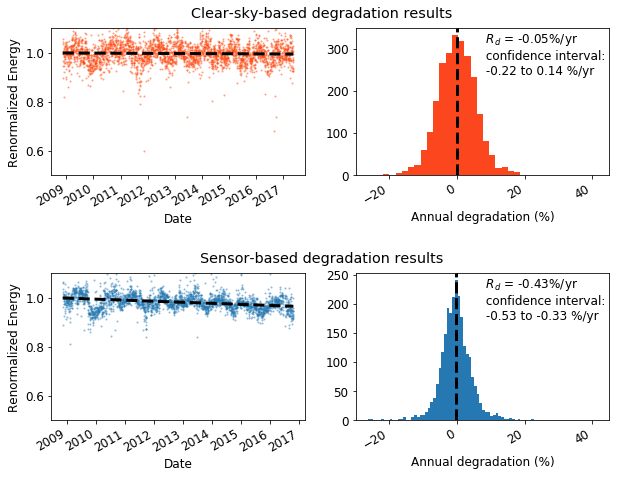
Two workflows are available for system performance ratio calculation, and illustrated in an example notebook. The sensor-based approach assumes that site irradiance and temperature sensors are calibrated and in good repair. Since this is not always the case, a 'clear-sky' workflow is provided that is based on modeled temperature and irradiance. Note that site irradiance data is still required to identify clear-sky conditions to be analyzed. In many cases, the 'clear-sky' analysis can identify conditions of instrument errors or irradiance sensor drift, such as in the above analysis.
The clear-sky analysis tends to provide less stable results than sensor-based analysis when details such as filtering are changed. We generally recommend that the clear-sky analysis be used as a check on the sensor-based results, rather than as a stand-alone analysis.
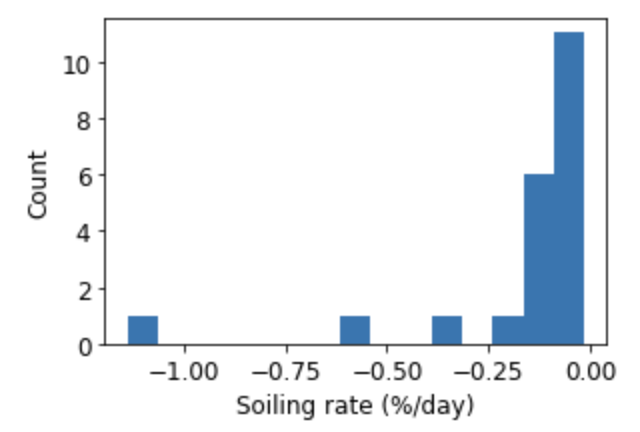
Soiling
Soiling can be estimated with the stochastic rate and recovery (SRR)
method (Deceglie 2018). This method works well when soiling patterns
follow a "sawtooth" pattern, a linear decline followed by a sharp
recovery associated with natural or manual cleaning.
soiling.soiling_srr() performs the calculation and returns the P50
insolation-weighted soiling ratio, confidence interval, and additional
information (soiling_info) which includes a summary of the soiling
intervals identified, soiling_info['soiling_interval_summary']. This
summary table can, for example, be used to plot a histogram of the
identified soiling rates for the dataset.
TrendAnalysis
An object-oriented API for complete soiling and degradation analysis including
the normalize, filter, aggregate, analyze steps is available in
analysis_chains.TrendAnalysis. See the
TrendAnalysis example for details.
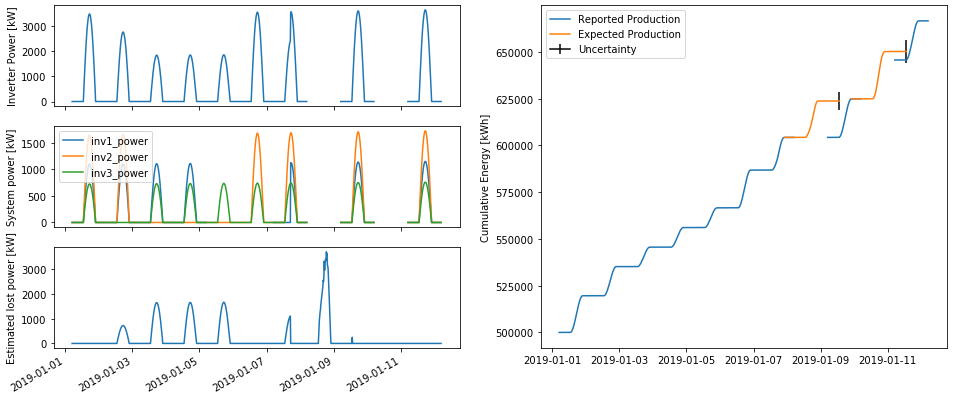
Availability
Evaluating system availability can be confounded by data loss from interrupted
datalogger or system communications. RdTools implements two methods
(Anderson & Blumenthal 2020) of distinguishing nuisance communication
interruptions from true production outages
with the availability.AvailabilityAnalysis class. In addition to
classifying data outages, it estimates lost production and calculates
energy-weighted system availability.
Install RdTools using pip
RdTools can be installed automatically into Python from PyPI using the command line:
pip install rdtools
Alternatively it can be installed manually using the command line:
Download a release (Or to work with a development version, clone or download the rdtools repository).
Navigate to the repository:
cd rdtoolsInstall via pip:
pip install .
On some systems installation with pip can fail due to problems
installing requirements. If this occurs, the requirements specified in
setup.py may need to be separately installed (for example by using
conda) before installing rdtools.
For more detailed instructions, see the Developer Notes page.
RdTools currently is tested on Python 3.7+.
Usage and examples
Full workflow examples are found in the notebooks in Examples.
The examples are designed to work with python 3.10. For a consistent
experience, we recommend installing the packages and versions documented
in docs/notebook_requirements.txt. This can be achieved in your
environment by first installing RdTools as described above, then running
pip install -r docs/notebook_requirements.txt from the base
directory.
The following functions are used for degradation and soiling analysis:
import rdtools
The most frequently used functions are:
normalization.normalize_with_expected_power(pv, power_expected, poa_global,
                                            pv_input='power')
  '''
  Inputs: Pandas time series of raw power or energy, expected power, and
     plane of array irradiance.
  Outputs: Pandas time series of normalized energy and POA insolation
  '''
filtering.poa_filter(poa_global); filtering.tcell_filter(temperature_cell);
filtering.clip_filter(power_ac); filtering.logic_clip_filter(power_ac);
filtering.xgboost_clip_filter(power_ac); filtering.normalized_filter(energy_normalized);
filtering.csi_filter(poa_global_measured, poa_global_clearsky);
  '''
  Inputs: Pandas time series of raw data to be filtered.
  Output: Boolean mask where `True` indicates acceptable data
  '''
aggregation.aggregation_insol(energy_normalized, insolation, frequency='D')
  '''
  Inputs: Normalized energy and insolation
  Output: Aggregated data, weighted by the insolation.
  '''
degradation.degradation_year_on_year(energy_normalized)
  '''
  Inputs: Aggregated, normalized, filtered time series data
  Outputs: Tuple: `yoy_rd`: Degradation rate
    `yoy_ci`: Confidence interval `yoy_info`: associated analysis data
  '''
soiling.soiling_srr(energy_normalized_daily, insolation_daily)
  '''
  Inputs: Daily aggregated, normalized, filtered time series data for normalized performance and insolation
  Outputs: Tuple: `sr`: Insolation-weighted soiling ratio
    `sr_ci`: Confidence interval `soiling_info`: associated analysis data
  '''
availability.AvailabilityAnalysis(power_system, power_subsystem,
                                  energy_cumulative, power_expected)
  '''
  Inputs: Pandas time series system and subsystem power and energy data
  Outputs: DataFrame of production loss and availability metrics
  '''
Documentation
Some RdTools function parameters can take one of several types. For example,
the albedo parameter of TrendAnalysis can be a static value like
0.2 or a time-varying pandas.Series. To indicate that a parameter can
take one of several types, we document them using the type alises listed below:
numeric¶scalar or
pandas.Series. Typically int or float dtype.
Citing RdTools
To cite RdTools, please use the following along with the version number and the specific DOI coresponding to that version from Zenodo:
Michael G. Deceglie, Ambarish Nag, Adam Shinn, Gregory Kimball, Daniel Ruth, Dirk Jordan, Jiyang Yan, Kevin Anderson, Kirsten Perry, Mark Mikofski, Matthew Muller, Will Vining, and Chris Deline RdTools, version {insert version}, Compuer Software, https://github.com/NREL/rdtools. DOI:{insert DOI}
The underlying workflow of RdTools has been published in several places. If you use RdTools in a published work, you may also wish to cite the following as appropriate:
Dirk Jordan, Chris Deline, Sarah Kurtz, Gregory Kimball, Michael Anderson, "Robust PV Degradation Methodology and Application", IEEE Journal of Photovoltaics, 8(2) pp. 525-531, 2018 DOI: 10.1109/JPHOTOV.2017.2779779
Michael G. Deceglie, Leonardo Micheli and Matthew Muller, "Quantifying Soiling Loss Directly From PV Yield," in IEEE Journal of Photovoltaics, 8(2), pp. 547-551, 2018 DOI: 10.1109/JPHOTOV.2017.2784682
Kevin Anderson and Ryan Blumenthal, "Overcoming Communications Outages in Inverter Downtime Analysis", 2020 IEEE 47th Photovoltaic Specialists Conference (PVSC). DOI: 10.1109/PVSC45281.2020.9300635
Kirsten Perry, Matthew Muller and Kevin Anderson, "Performance Comparison of Clipping Detection Techniques in AC Power Time Series," 2021 IEEE 48th Photovoltaic Specialists Conference (PVSC), 2021, pp. 1638-1643, DOI: 10.1109/PVSC43889.2021.9518733
References
The clear sky temperature calculation,
clearsky_temperature.get_clearsky_tamb(), uses data from images created by Jesse Allen, NASA’s Earth Observatory using data courtesy of the MODIS Land Group.
Other useful references which may also be consulted for degradation rate methodology include:
D. C. Jordan, M. G. Deceglie, S. R. Kurtz, "PV degradation methodology comparison — A basis for a standard", in 43rd IEEE Photovoltaic Specialists Conference, Portland, OR, USA, 2016, DOI: 10.1109/PVSC.2016.7749593.
Jordan DC, Kurtz SR, VanSant KT, Newmiller J, Compendium of Photovoltaic Degradation Rates, Progress in Photovoltaics: Research and Application, 2016, 24(7), 978 - 989.
D. Jordan, S. Kurtz, PV Degradation Rates – an Analytical Review, Progress in Photovoltaics: Research and Application, 2013, 21(1), 12 - 29.
E. Hasselbrink, M. Anderson, Z. Defreitas, M. Mikofski, Y.-C.Shen, S. Caldwell, A. Terao, D. Kavulak, Z. Campeau, D. DeGraaff, "Validation of the PVLife model using 3 million module-years of live site data", 39th IEEE Photovoltaic Specialists Conference, Tampa, FL, USA, 2013, p. 7 – 13, DOI: 10.1109/PVSC.2013.6744087.
Documentation Contents
- Examples
- API Reference
- Change Log
- v2.1.6 (July 31, 2023)
- v2.1.5 (May 16, 2023)
- v2.1.4 (December 1, 2022)
- v2.1.3 (January 6, 2022)
- v2.1.2 (December 22, 2021)
- v2.1.1 (November 30, 2021)
- v2.1.0 (September 17, 2021)
- v2.0.6 (July 16, 2021)
- v2.0.5 (2020-12-30) and v2.1.0-beta.2 (2021-01-29)
- v2.0.4 and v2.1.0-beta.1 (December 4, 2020)
- v2.1.0-beta.0 (November 20, 2020)
- v2.0.3 (November 20, 2020)
- v2.0.2 (November 17, 2020)
- v2.0.1 (October 30, 2020)
- v2.0.0 (October 20, 2020)
- v1.2.3 (April 12, 2020)
- v1.2.2 (October 12, 2018)
- v1.2.1 (October 12, 2018)
- v1.2.0 (March 30, 2018)
- v1.1.3 (December 6, 2017)
- v1.1.2 (November 6, 2017)
- v1.1.1 (November 1, 2017)
- v1.1.0 (September 30, 2017)
- Developer Notes